
Commercial ESS Payback: Demand Charges, Tariffs and Utilization
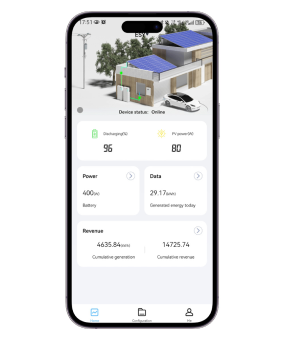
Commercial ESS projects typically achieve payback through a combination of demand charge reduction, tariff optimization, and high battery utilization. A well-designed system can reduce monthly peak demand by 10%–40%, improve solar self-consumption from around 50% to over 80%, and reach payback periods of approximately 3–7 years depending on electricity rates, operating cycles, and installation costs.
Commercial energy storage economics are mainly determined by how the battery interacts with the electricity bill structure. Unlike residential customers, commercial facilities often face demand charges based on their highest power consumption during a billing period. A factory, office building, hotel, or campus may consume moderate energy throughout the day but still receive a large bill because of several short peak events.
In many regions of the United States, demand charges account for 30%–70% of a commercial electricity bill. A facility with a monthly peak demand of 1,500 kW and a demand rate of $25/kW-month may spend $37,500 every month on demand-related costs. Reducing only 300 kW of peak demand can lower the monthly bill by about $7,500, creating annual savings close to $90,000.
The size and operating strategy of an ESS determine how much of this reduction can be achieved. A battery system must have sufficient power output to cover peak events rather than only focusing on energy capacity. A 1 MWh battery with a 100 kW inverter cannot provide the same demand reduction as a 500 kWh battery with a 250 kW inverter when short peak events occur.
Commercial ESS performance depends on matching battery power rating, capacity, and tariff conditions instead of installing the largest possible battery size.
Demand charge savings are usually calculated through peak shaving strategies. The battery remains charged during low-cost periods and discharges when facility demand approaches the expected monthly peak. Many commercial systems use energy management software that analyzes historical load data, weather conditions, and production schedules.
A manufacturing facility operating 250 working days per year may experience hundreds of potential peak events. If an ESS reduces peak demand by 250 kW for 200 billing periods annually and the demand rate is $30/kW-month, the estimated annual reduction can reach approximately $75,000. The actual result depends on utility measurement intervals, which are commonly 15 minutes in many commercial tariffs.
Tariff structures strongly influence ESS economics because electricity prices change by time period. Time-of-use tariffs create price differences between daytime peak hours and lower-cost overnight periods. In some markets, peak electricity prices can be 2–4 times higher than off-peak prices.
For example, an ESS charging 500 kWh overnight at $0.08/kWh and discharging during a period priced at $0.24/kWh creates a theoretical energy spread of $0.16/kWh. If the battery completes 300 cycles per year, annual energy arbitrage potential before efficiency losses can exceed $24,000.
However, battery efficiency and degradation must be included. Commercial lithium-ion systems generally operate with round-trip efficiency of 85%–95%. A battery storing 500 kWh may deliver approximately 425–475 kWh after conversion losses. Over a 10-year operating period, usable capacity may decline to 70%–80% depending on temperature control, depth of discharge, and cycling frequency.
Battery utilization determines whether the installed equipment generates sufficient financial returns. A system used only for emergency backup may complete fewer than 50 cycles per year, while a daily peak shaving system may exceed 300 cycles annually.
| Operating Mode | Annual Cycles | Typical Application |
|---|---|---|
| Backup power | <50 cycles/year | Critical facilities |
| Peak shaving | 200–300 cycles/year | Industrial and commercial sites |
| Tariff optimization | 300–500 cycles/year | High electricity price variation areas |
| Solar integration | 250–400 cycles/year | Commercial solar users |
Higher utilization improves the economic performance of the battery because the same equipment produces more annual electricity savings. This approach requires accurate load analysis before installation.
Commercial facilities with solar generation often achieve stronger economics when ESS is added. Solar output usually peaks around midday, while many commercial electricity peaks occur in the afternoon or early evening. Storage shifts solar energy into higher-price periods and reduces electricity purchased from the grid.
A commercial building with a 1 MW solar array may export excess electricity during periods of low demand. Adding a battery system can increase solar self-consumption from approximately 50% to more than 80%, depending on the load profile and battery size. The result is improved use of onsite generation and reduced exposure to higher electricity prices.
Products such as ES125-261 ESS by ESYsunhome are designed for commercial and industrial applications where capacity, power output, and energy management functions must work together. Systems in this category are commonly evaluated based on usable energy capacity, inverter rating, cycle life, safety configuration, and compatibility with facility energy management platforms.
The installed cost of commercial ESS includes more than battery cells. A complete project normally includes battery cabinets, power conversion equipment, control systems, engineering design, installation, commissioning, and grid connection requirements.
Typical cost components include:
| Component | Approximate Project Share |
|---|---|
| Battery modules | 40%–60% |
| Power conversion system | 15%–25% |
| Energy management system | 5%–10% |
| Installation and engineering | 15%–30% |
Battery prices have declined significantly over the past decade. Lithium-ion battery pack prices decreased by more than 80% between 2013 and 2023, improving the financial feasibility of commercial storage projects. At the same time, installation costs, permitting requirements, and safety standards remain important parts of the project budget.
Payback periods vary based on site conditions. Facilities with high demand charges and frequent peak events may achieve payback in 3–5 years, while locations with lower electricity price differences may require 6–10 years. Incentive programs, tax credits, and utility rebates can shorten the recovery period.
A commercial ESS financial model usually considers:
| Parameter | Example Range |
|---|---|
| Battery capacity | 250 kWh–5 MWh |
| Power rating | 100 kW–2 MW |
| Daily cycles | 0.5–1 cycle/day |
| Round-trip efficiency | 85%–95% |
| Expected service life | 10–15 years |
Energy management software has become an important part of commercial ESS operation. Modern systems can schedule charging and discharging based on electricity prices, building demand forecasts, solar production, and grid conditions. Instead of using a fixed schedule every day, the battery can adjust operation according to actual facility conditions.
A battery with lower utilization may have a longer payback period even when the equipment price is lower, while a properly scheduled system can produce more annual savings from the same installed capacity.
Future commercial ESS projects are increasingly evaluated through multiple revenue sources rather than electricity bill reduction alone. Demand response programs, virtual power plants, and grid support services are being introduced in several markets. These programs allow commercial batteries to provide additional grid functions while continuing normal facility operations.
The financial result of a commercial ESS depends on the relationship between electricity tariffs, facility load patterns, battery operation, and long-term equipment performance. Projects that combine peak shaving, tariff optimization, and renewable integration typically achieve stronger economics than systems designed for only one purpose. For commercial users, accurate load analysis and suitable system sizing remain the foundation of achieving a reasonable payback period.
Stop reading about it. Start performing like it.
Build your High10 Game Plan with a 4-person coaching pod. Measurable KPI movement in 90 days — guaranteed.
Get My High10 Game Plan